Introduction:
GDP is essential as a key indicator of the health and direction of the economy. It shows the total value of goods and services produced within the nation’s borders and offers data on several significant topics.
Economic Growth: A growing GDP indicates that the economy is expanding and has the potential to create more jobs, develop more infrastructure, and raise living standards.
Investment & Trade: A robust GDP encourages international trade and draws in foreign capital, which further stimulates economic activity.
Policy Formulation: The government creates policies to control inflation, promote economic growth, and combat poverty using GDP data.
Social Development: GDP indirectly affects social development by providing funding for social programs like healthcare and education, even though it is not a reliable indicator of well-being on its own.

Insights from the RBI report on GDP:
GDP figures released by the statistics ministry shows that the Indian economy grew 7.6% during the July-September quarter of the current financial year 2023–24 (Q2FY24), continuing to be the fastest-growing major economy in the world.
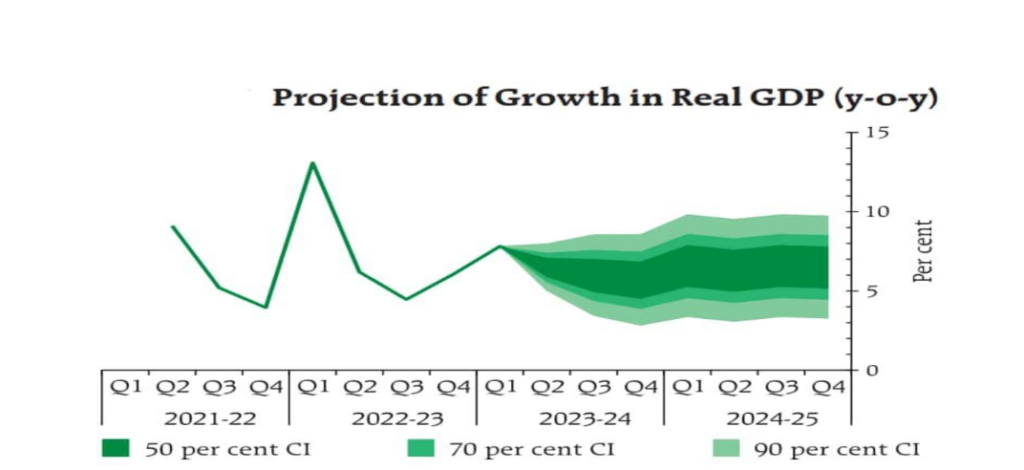
RBI’s ESTIMATED ANALYSIS FOR FIRST HALF OF FY24:
In the first half of FY24, the estimated real GDP growth was registered at 7.7%. To achieve an annual growth rate of 6.5% in FY24, the second half growth of FY24 needs to be 5.4%. This requirement is less than RBI’s projection of 5.8%. It is evident from the fact that Bharat’s economy is the highest among the major advanced and emerging economies.
NOMINAL GDP AND GROWTH:
Nominal GDP growth of Q2:FY24 stands at 9.2% with a GDP deflator of 1.5%. This shows the moderation in CPI inflation and deflation in WPI in H:FY24. Also, gross tax revenues of the central government growing at 16.3% against a nominal GDP growth of 8.6% in H1:FY24, estimating a tax buoyancy of 1.9% showcasing fiscal resilience.
SECTORAL PERFORMANCE:
Private consumption share in GDP rises from 59.7% in Q1:FY24 to 62% in Q2:FY24. Exports increased from 21.4% in Q1:FY24 to 21.9% in Q2:FY24. Import also increases from 23.8% in Q1:FY24 to 24.4% in Q2:FY24. This reflects the robustness of service exports and increasing demand arising out of growing income I domestic economy. Accordingly, trade deficit has slightly worsened to 2.5% in Q2:FY24.
SECTORAL GROWTH IN MANUFACTURING SECTOR:
Manufacturing sector witnesses a substantial real GVA growth of 13.9% in Q2:FY24, supported by strong private consumption. Construction also shows a remarkable jump to 13.3% due to increased demand in real estate and amplified government capex which increased by 40%. However, trade, hotels, transports etc., experience a decline from 9.1% in Q1:FY24 to 4.3% in Q2:FY24, potentially linked to the easing of earlier pent-up demand.
HIGH-FREQUENCY INDICATORS FOR Q3:FY24:
This indicator shows for October a sustained growth momentum. Purchasing manager index (PMI) manufacturing remained in expansionary zone reaching 55.5% and buoyant services PMI backed by robust industrial and service sector output, continue to drive economic expansion.
REVENUE COLLECTION AND FISCAL OUTLOOK:
GST collection of Rs 1.76 lakh crore and net tax revenues which increased by 11.2% exhibit significant growth, providing a strong revenue position for the government. The rising revenue, along with prudent expenditure management, is expected to keep the fiscal deficit within the targeted limit.
RBI Statement:
Table 1: A cross-country comparison of Real GDP growth in the April-September period of 2023
| India | 7.7 |
| China | 5.6 |
| Indonesia | 5.1 |
| Mexico | 3.4 |
| USA | 2.7 |
| Japan | 1.5 |
| France | 0.9 |
| UK | 0.6 |
| Germany | -0.2 |
Table 2: India’s Real GDP growth projections for 2023-24 by various international agencies
| RBI | 6.5% |
| Asian Development Bank (ADB) | 6.4% |
| World Bank | 6.3% |
| Fitch | 6.3% |
| International Monetary Fund (IMF) | 6.3% |
| Moody | 6.1% |
| Organisation for Economic Cooperation and Development (OECD) | 6.0% |
| Standard and Poor | 6.0% |
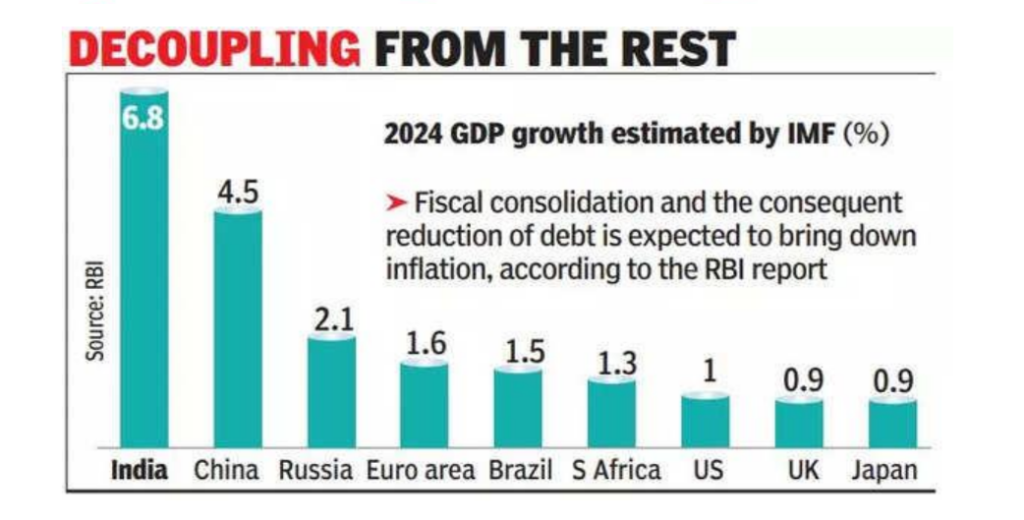
GLOBAL COMPARISON AND PROJECTIONS:
As per data, Bharat has outperformed in terms of real GDP growth with 7.7% in comparison to other major economies like China, Indonesia etc. Bharat’s real GDP growth projection is far better than projected growth by world bank, moody and even RBI.
CONCLUSION:
Bharat’s Q2:FY24 GDP growth exceeding projections, sustained economic momentum, and optimistic forecasts has underscore country’s resilience & potential for robust growth in the FY24. Various international agencies and institutions have projected a positive growth ranging between 6% -6.5%. This is indicating a broadly optimistic sentiment towards Bharat’s economic growth.
Overall, Bharat’s economy has demonstrated strong economic growth drivers, robust tax collection, high-frequency indicators.